Grid of Spheres#
import matplotlib.pyplot as plt
import numpy as np
import treams
k0 = 2 * np.pi / 700
materials = [treams.Material(-16.5 + 1j), treams.Material()]
lmax = 3
radii = [75, 75]
positions = [[-75, 0, 30], [75, 0, -30]]
lattice = treams.Lattice.square(300)
kpar = [0, 0]
spheres = [treams.TMatrix.sphere(lmax, k0, r, materials) for r in radii]
array = treams.TMatrix.cluster(spheres, positions).latticeinteraction.solve(
    lattice, kpar
)
inc = treams.plane_wave([0, 0, k0], [-1, 0, 0], k0=array.k0, material=array.material)
sca = array @ inc.expand(array.basis)
x = np.linspace(-150, 150, 31)
y = 0
z = np.linspace(-150, 150, 31)
xx, zz = np.meshgrid(x, z, indexing="ij")
yy = np.full_like(xx, y)
grid = np.stack((xx, yy, zz), axis=-1)
ez = np.zeros_like(xx)
valid = array.valid_points(grid, radii)
vals = []
for i, r in enumerate(grid[valid]):
    swb = treams.SphericalWaveBasis.default(1, positions=[r])
    field = sca.expandlattice(basis=swb).efield(r)
    vals.append(np.real(inc.efield(r)[2] + field[2]))
ez[valid] = vals
ez[~valid] = np.nan
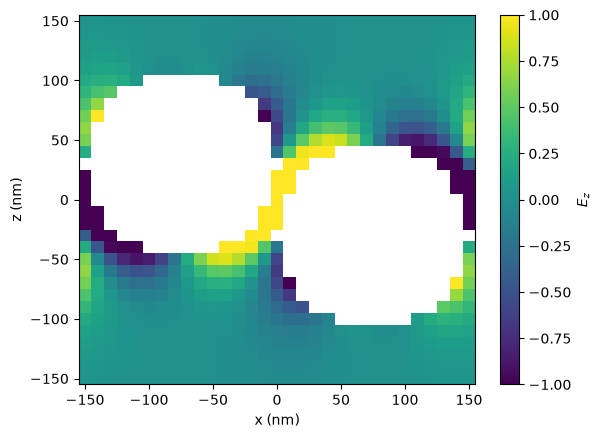
fig, ax = plt.subplots()
pcm = ax.pcolormesh(
    xx, zz, ez, shading="nearest", vmin=-1, vmax=1,
)
cb = plt.colorbar(pcm)
cb.set_label("$E_z$")
ax.set_xlabel("x (nm)")
ax.set_ylabel("z (nm)")
fig.show()